

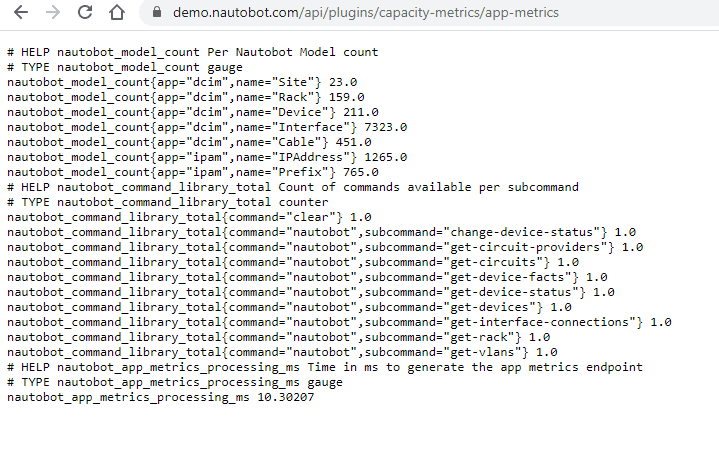
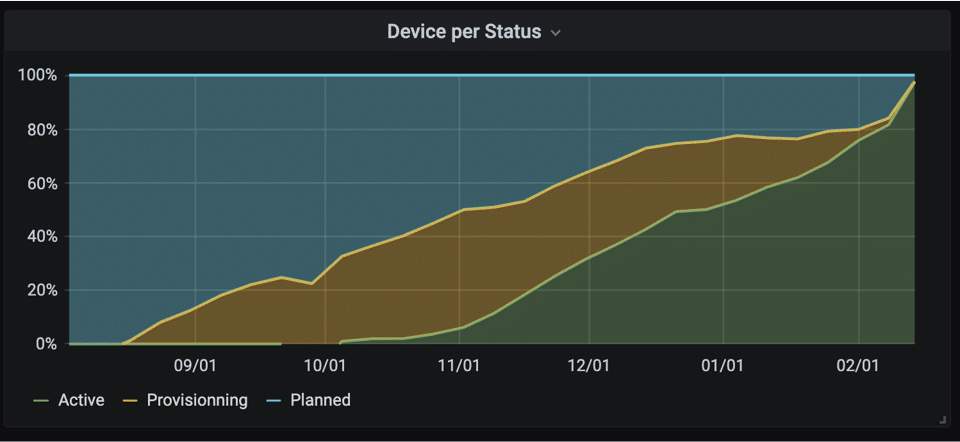
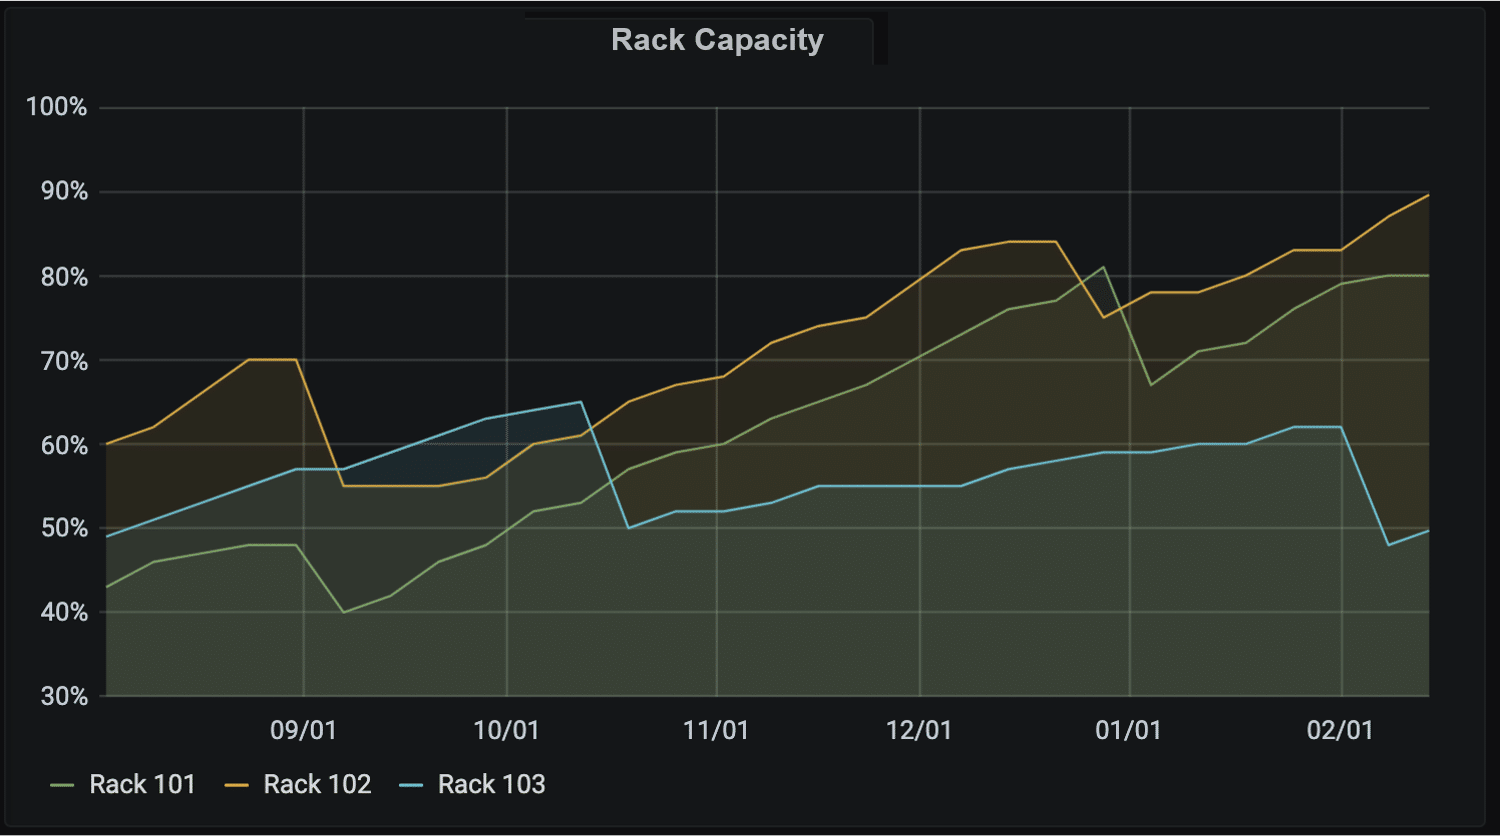
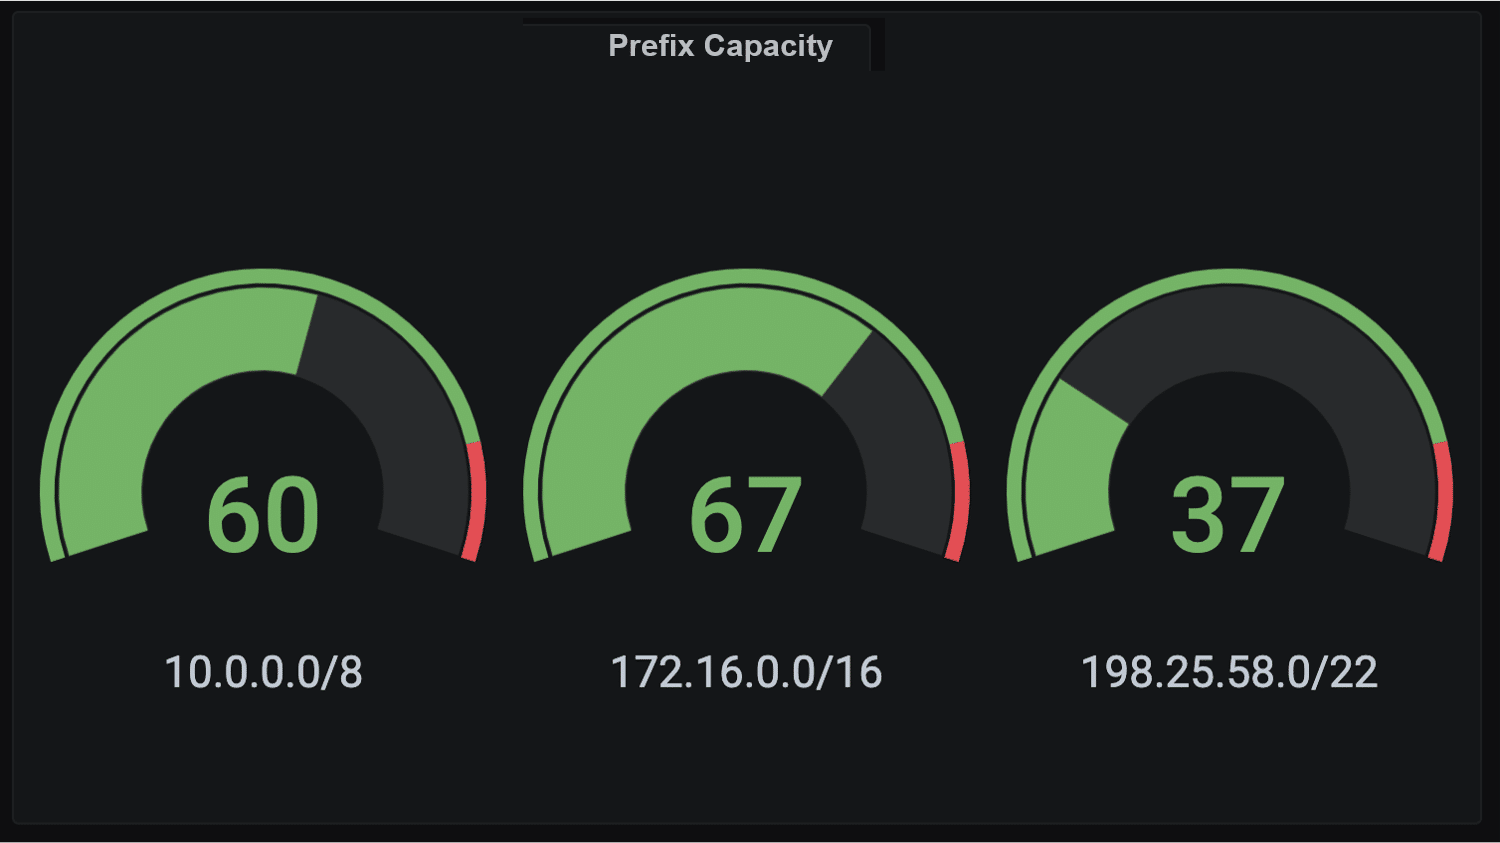
The Nautobot capacity metrics app exposes key data stored in Nautobot as a Prometheus HTTP endpoint so the data can be easily scraped, collected, stored, and visualized. The app exposes metrics and meta data for devices, IP addresses, VLANs, prefixes, interfaces, racks, and anything else that makes sense to track. Exposing this data and visualizing it in a tool like Grafana will allow users to track growth, trends, interface capacity, site and rack utilization and capacity, IP consumption just to name a few of the common use cases.


Share details about yourself & someone from our team will reach out to you ASAP!
